MMT User Guide
Monitoring Tool of MEASURE
Platform
••••••••••••••••••••••••••••••••••••••••••••••••••••••
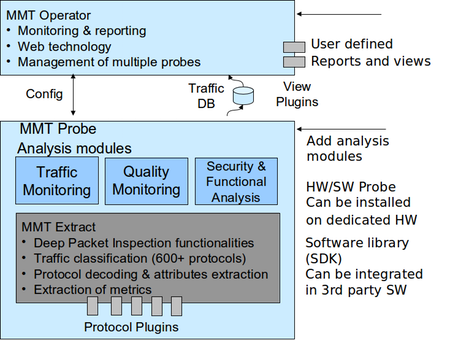
Montimage Monitoring Tool (MMT) is a monitoring solution that combines data capture, filtering and storage, events extraction and statistics collection, and traffic analysis and reporting, providing network, application, session, and user-level visibility. Furthermore, it is able to correlate information from different sources to detect complex events, and thanks to an advanced rule-based engine, propose counter-measures to react to detected situations (e.g., performance, security, operational incidents). MMT performs online and offline monitoring of the traces of a running system, and it allows the extraction of complex measurements from individual pieces of data. It is able to operate in a non-obstructive fashion, since the execution traces are observed without interfering with the behaviour of the system.
MMT can be easily integrated with third parties in various ways: structured data produced by other applications or systems can feed the Extract module; extracted data and detected events can be used by other tools; behaviour models, pattern matching rules, etc. can be converted to properties to correlate information; and verdicts and events can be used by external tools. All these functionalities are summarized in the MMT global view presented in Figure below.
MMT-Operator
This
document presents Graphical User Interface of MMT-Operator.
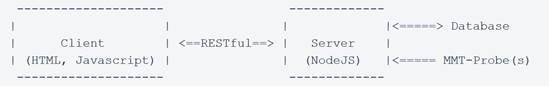
MMT-Operator
is a Web application. It has typically 2 parts: Client (front end) and Server
(back end).
·
The Server is
written in NodeJS running at the server side.
·
The Client is
written in JavaScript and HTML running on Web browsers at the client sides.
There may be many users using their Web browsers to connect to the Server to
statistics of MMT. These statistics will be graphically represented in Web
browsers of users in forms of chart elements, such as, bar, line, pie, or
table. This document presents in detail of the elements.
General
Structure
The
followings are some basic notations being used in MMT:
- Protocol is a network protocol such as,
IP, HTTP, NDN, etc.
- Application such as BitTorrent, Skype,
etc. Contact us to get the full list of protocols and applications that
have been supported by MMT.
- Profile is a group of protocols and/or
applications. MMT-Operator has currently 13 profiles: Content Delivery
Network, Cloud Storage, Conversational, DataBase, Direct Download Link,
File Transfer, Gaming, Mail, Network, Peer to Peer, SocialNetwork,
Streaming, Web.
- Packet is a term used in MMT to
represent a data unit of a protocol. It is not restricted only for
protocols at layer 3 of OSI. A packet consists of a header part and
payload part. Header part contains control information that
provides data for delivering the payload, for example: source and
destination network addresses, error detection codes, and sequencing
information. Payload part contains user data that may be a packet of a
higher protocol, e.g., payload of IP packet can be a TCP packet.
- Micro Session is a set of very small
sessions. A session is considered as a micro one if its number of packets
and data are less than some thresholds. MMT allows user to change easily
these thresholds via a configuration file. Micro session will not be
reported separately, rather, aggregated statistics from micro sessions
will be reported together. Using micro sessions statistics reduces the
report size. However, one will loose microscopic information about these
micro sessions.
- Network traffic are represented
through 4 metrics:
- Data Volume is size of data, in Bytes or
Bits, of packets.
- Payload Volume is size of payload part, in
Bytes or Bits, of packets.
- Packet Count is number of packets.
- Session Count is number of TCP/IP sessions.
Each session is differed by a 4-tuple (IP source, IP destination, Port
source and Port destination).
The
following things are applied on GUI:
- When a button is available, the
cursor will be change to a pointer when moving over the button.
- The changing of display, such
as, delete/resize a Report, reorder Report, etc., is only locally. It only
effects the current Web browser.
Tab
Statistics
will be grouped into tabs, e.g., Link, Network, Application, DPI, Security,
Evasion and Setting.
Each tab
has a Toolbar and a set of Reports. The Figure below represents the Application
tab having 3 reports: Top Users, Top Applications and Top Remotes.
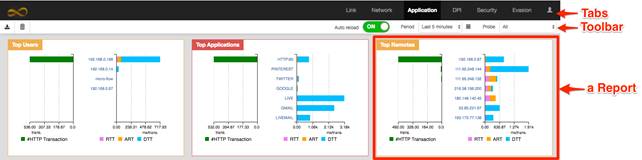
Toolbar
The toolbar
often shows the following buttons, from left to right:
- Export Charts to Images
 : When click on this button, all displayed
Reports will be exported to .png files. You might allow Google Chrome to
download multiple files to download several report pictures.
: When click on this button, all displayed
Reports will be exported to .png files. You might allow Google Chrome to
download multiple files to download several report pictures. - Delete a Report
 : Drag and drop a Report over this button
to delete that Report.
: Drag and drop a Report over this button
to delete that Report. - Reset View
 : Click on this button to reset the view
of reports to the initial state.
: Click on this button to reset the view
of reports to the initial state. - Auto Reload
 : When it is enabling, the current Tab is
automatically reloaded periodically.
: When it is enabling, the current Tab is
automatically reloaded periodically. - Period
 decides a period of statistic to shown,
such as, the statistic of the last 5 minutes. The available periods are:
Last 5 minutes, Last hour, Last 6 hours, Last 12 hours, Last 24 hours,
Last 7 days, and, Last 30 days.
decides a period of statistic to shown,
such as, the statistic of the last 5 minutes. The available periods are:
Last 5 minutes, Last hour, Last 6 hours, Last 12 hours, Last 24 hours,
Last 7 days, and, Last 30 days.
One might
also select a period between two dates by clicking on a small calendar button
at the right of combobox.
- Probe
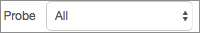 lists all running MMT-Probe in the
current Period. If there is only one MMT-Probe, this combobox has only one
value "All". When more than one MMT-Probe is running, one might
select the combobox to see the statistics of one or all MMT-Probes.
lists all running MMT-Probe in the
current Period. If there is only one MMT-Probe, this combobox has only one
value "All". When more than one MMT-Probe is running, one might
select the combobox to see the statistics of one or all MMT-Probes.
Please note
that, one of the buttons above can be hidden on some specific Tabs.
Report
A Report
graphically represents a statistic of MMT. A Report consist of :
- A title located on the top-left corner
- One or many Filters to filter out unnecessary
data. When user changes value of a Filter, the other Filters and Charts
will be reloaded.
- One or many Charts is the main part of a Report.
A Chart might depend on another, e.g., when an element in a Chart is
selected another Chart will be reloaded to show the statistic concerning
to the selected element.
One can do
the following actions on Report:
- Delete a Report: This action is available when
there are more than one Report on a Tab. In such a case, there exists a
RecycleBin icon on the left of Toolbar.
To delete a
Report, click and hold on the title of the report, then drag and drop it on the
RecycleBin icon.
- Resize a Report: To resize a Report, move
cursor to an edge of Report, then drag cursor to resize it. Some Reports
cannot be resized.
- Reorder Reports in a Tab: To reorder Reports, drag and
drop a Report to a position by click and hold on its title.
- Save a Report as a Picture: Click on the left button on
the Toolbar.
Chart
Tab Link
This tab
gives an overview of the network being monitored by MMT-Probes, such as,
Input/output traffic, the top 7 protocols having highest traffic, list of
active nodes since the last 5 minutes. On each report, one can click on detail
button ![]() to view bandwidth of an individual
such as a protocol or a node.
to view bandwidth of an individual
such as a protocol or a node.
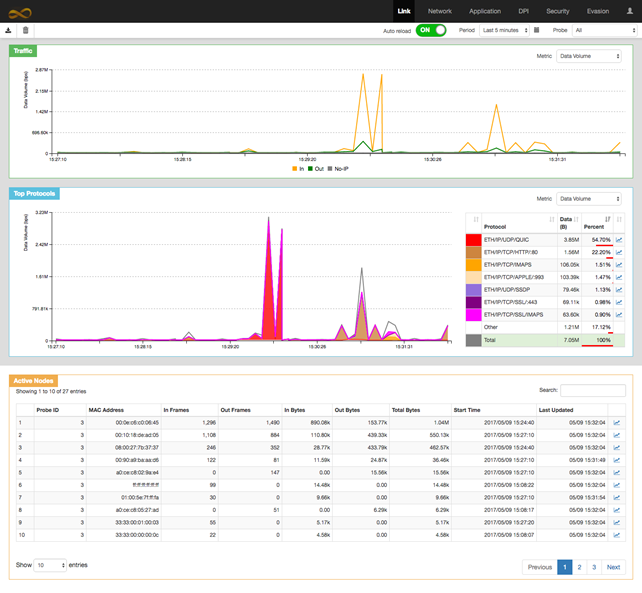
Tab link
consists of 3 reports:
- Traffic represents the total bandwidth
of the network representing via 3 lines: in-bound and out-bound of IP
traffic, along with the total bandwidth of other traffic that are non-IP
based protocols such as ARP.
One can
click on a legend item ![]() to hide/unhide the line
corresponding.
to hide/unhide the line
corresponding.
- Top Protocols contains the top 7 protocols.
This report consists of 2 charts: the left one represents historical
bandwidth, in bit per second, of the top protocols; the right one is the
list of these protocols along with their total data and percentage.
One can
click on one item of the list to hide/unhide the line corresponding on the left
side.
- Active Nodes contains the information about
the nodes in the network that are being active since the last 5 minutes. A
node in a network is identified by its unique media access control address
(MAC address).
This report
is not influenced by the Period filter on the toolbar. It always shows the
active nodes since the last 5 minutes or the moment started MMT if MMT has been
started less than 5 minutes.
Each row in
the table represents a unique. Only the active nodes since the last minutes
have statistical data. The statistic of the nodes, that were active since the
last 5 minutes and inactive since the last minutes, are set to zero.
The start
time and the last updated time are respectively the first and latest moment MMT
saw a packet coming/outgoing to this node
Tab Network
This tab gives at the glance the top factors in the networks, such as, top users, top profiles, top locations, top links. These factors consume the most traffic. One can also inspect deeply one session.
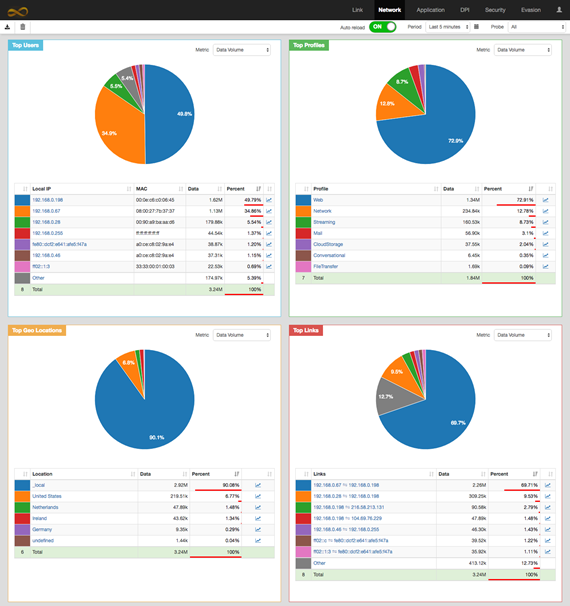
Tab Network consists of first 4 reports. Each report contains the top 7 factors being represented in 2 charts:
- The pie chart represents the
percentages of each factor.
- The table gives the detailed
list of factors.
For each
row of the table,
- Click on one color item, on
the left, to hide/unhide the pie corresponding
- Click on link name to inspect
the detail of its factor
- Click on
 to
show bandwidth used by its factor
to
show bandwidth used by its factor
- Top Users is the top 7 users in the
network. Each user is identified by a unique IP address.
- Top Profiles is the top 7 Profiles in the
network. When click on one profile name, one will get the top 7
applications or protocols of the profile.
- Top Geo Locations is the top 7
destination countries. _local represents the traffic of 2 users in the network.
- Top Links is the top 7 links. One link
represents the traffic between 2 users in the network or one user with
another from outside the network.
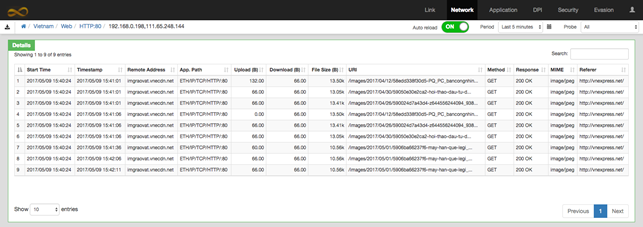
To inspect
in detail of one session, one can click on name of each factor. For example, on
can:
- click on Vietnam in the Top Geo
Location,
- then Web on the Profiles,
- then HTTP:80
- then 192.168.0.198 <->
111.65.248.144,
then one obtains the
following list:
Tab DPI
Tab DPI gives information about hierarchy of
protocols/applications. It consists of 1 Report: Protocol Hierarchy.
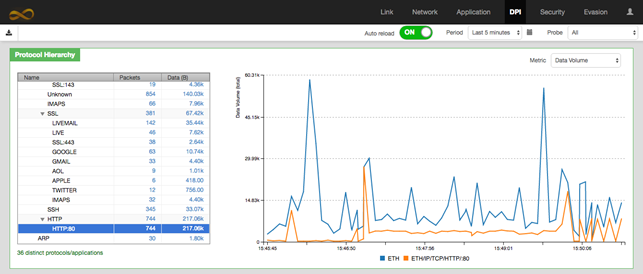
The Protocol Hierarchy
report has 2 charts: a tree chart on the left and a line chart on the right.
·
The tree chart represents the
hierarchy of protocols, e.g., there are 36 distinct protocols/application in
the figure above.
- Click on
 to
collapse/expand the tree.
to
collapse/expand the tree. - Click
on a hyper-link to select/deselect its protocol. When a protocol is
selected, its traffic will be shown on the right chart
·
The line chart represents the
traffic of the selected protocols of the tree chart. These lines do not
represent the bandwidth of the protocols but their total traffic during a
sample period that is 5 seconds by default.
Through this chart, one can easily see a consistency between protocols. For example, in the figure above, we found that the HTTP traffic vs the total traffic that is represented by ethernet.
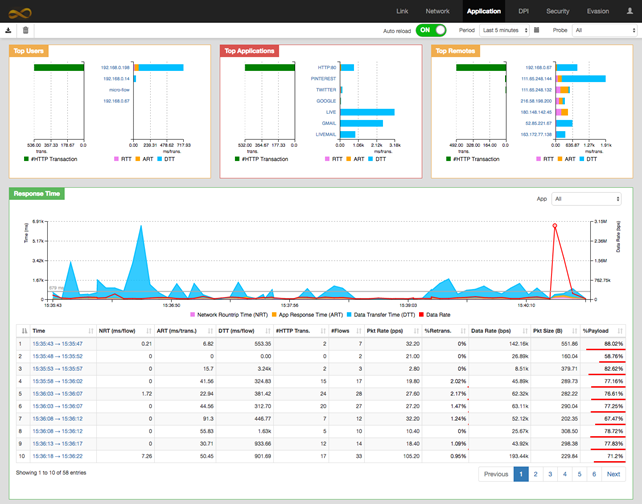
Tab Application
Tab Application shows the information about the network's round-trip time, data transfer time, application response time and data rate for the selected application type from the App tab. Moreover, the detailed information is provided in the tables for each application every 5 seconds, that are application response time, data transfer time, server data transfer time, client transfer time, network round-trip time, Number of HTTP transaction, number of active flows, packet rate, data rate, packet size and percentage of payload.
This Tab currently
supports only protocols/applications on the top of HTTP and FTP.
- FTP Response Time is the time elapsed between a client
sending a request to a FTP server and receiving the response packet. The
response time includes the 3 ways TCP handshake.
- HTTP response Time is the time elapsed between a client
application sending a request (GET) to a HTTP server and receiving the
response packet.
Initial TCP RTT
(Handshake): Initial RTT of an application is determined by looking at the TCP
Three Way Handshake. It is the time elapsed between TCP-SYN and TCP-ACK in the
TCP Three Way Handshake.
- NRT, Network Response Time, is measured by a TCP handshake.
- ART, Application Response Time,
- DTT, Data Transfer Time,
- #HTTP Trans is the number of HTTP transitions. An
HTTP transition is counted from starting a request to receiving completely
its response. Different HTTP transitions can perform through only one
TCP/IP session.
- #Flows indicates the number of TCP/IP sessions.
- Pkt rate (pps) indicates the average number of
packets received per second
- %Retrans. is the percentage of number of packets being retransmitted
- Data rate (bps) indicates the average number of bits
received per second
- Packet size (B) indicates an average packet size, in
Bytes
- %Payload indicates the percentage of payload on the total data. When this
percentage closes to 100%,
Tab Security and Evasion
Tab Security and Tab
Evasion list all security alerts. The alerts are grouped by property and probe
ID. These tabs list only the latest 5000 alerts.
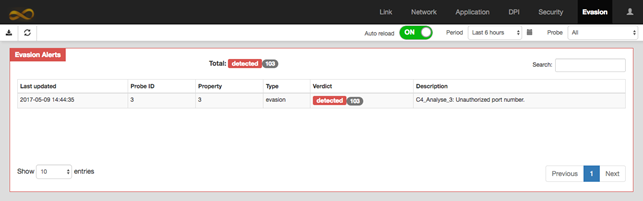
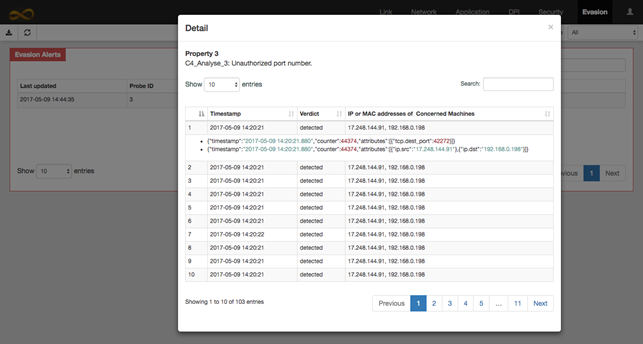
Each tab has only one report consisting of one table. Each row of the table represents the alerts of one property. One can click on one row to see the alerts as in the figure below.
Tab Setting
Tab setting gives some
statistic of server hosting MMT-Operator such as CPU usage, memory and hard
driver free space. It also allows user to update setting of MMT-Operator,
backup database.
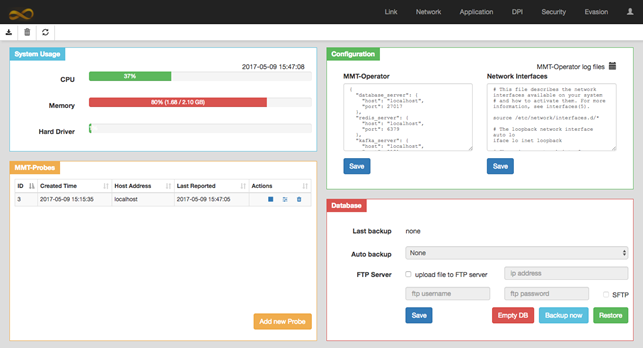
Tab Setting consists of
4 reports.
- System Usage gives a statistic of usage of the
server on that MMT-Operator is running.
- Configuration allows to:
- update file config.json of MMT-Operator
- update file /etc/network/interfaces of the server
- view execution logs of MMT-Operator
- MMT-Probes allows to manager MMT-Probe. One can install MMT-Probe on a remote
server by giving permission to MMT-Operator to log on that server via SSH.
When clicking on Add
new Probe button, one is led to another window to enter SSH information of
the remote server. After entering successfully, MMT-Operator will install a new
MMT-Probe on the server and add it to the list of management.
For the existing
MMT-Probe, one can:
- stop/start a probe
- update config file of a probe
- uninstall a probe
- DataBase
- Save button saves information in the form: Auto
backup, FTP Server
- Empty DB button empties database that contains MMT
statistic. This does not change user information such as password,
license, and information in this tab.
After clicking on the button, one need to confirm in another windows before
MMT-Operator can empty its database.
- Backup now button backups immediately database
using the current setting. After clicking on the button, one need to
confirm the action.
- Restore button leads user to another window to select a
backup image from a list of available ones to restore.
Others
- Login: Default login information are admin/ mmt2nm for username/password respectively.
- Change Password: One can change the current password
by clicking on
 button, then "Change
password".
button, then "Change
password".
Update Licence: One can update the licence by clicking on ![]() button, then "Profile".
button, then "Profile".